Infogram
Create good content in a visual way - infographics, charts, reports, presentations and maps. Basic account free / pay for more features / non-profit discount.
Discounts for NGOS, Free with limits
Small teams, Larger organisations - 50+ people
Medium difficulty to set up
Top Benefits: Time saving, Add impact
1 like
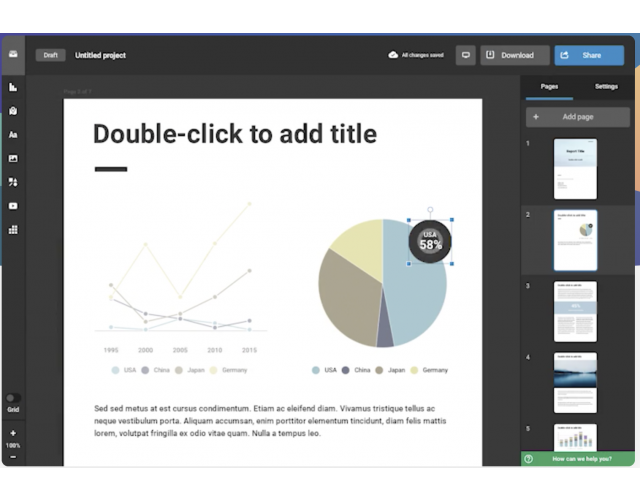
A visualisation tool for communicating data (a way to create charts, infographics, reports, presentations and maps from your data), Infogram helps you to present your data in a creative, interactive and professional way.
Main features
- make data easier to understand and remember
- discover unknown facts and trends
- see patterns quickly
- ask better questions and make better decisions
- free forever with limits - up to 10 projects, up to 5 pages per project etc
- note: free account means your projects are searchable online (ie public)
- monthly payment (discounts for non-profits) for additional features with access to more images and templates
Like:
